Backtesting the four classical harmonic patterns
May 30, 2026 • 11 min read
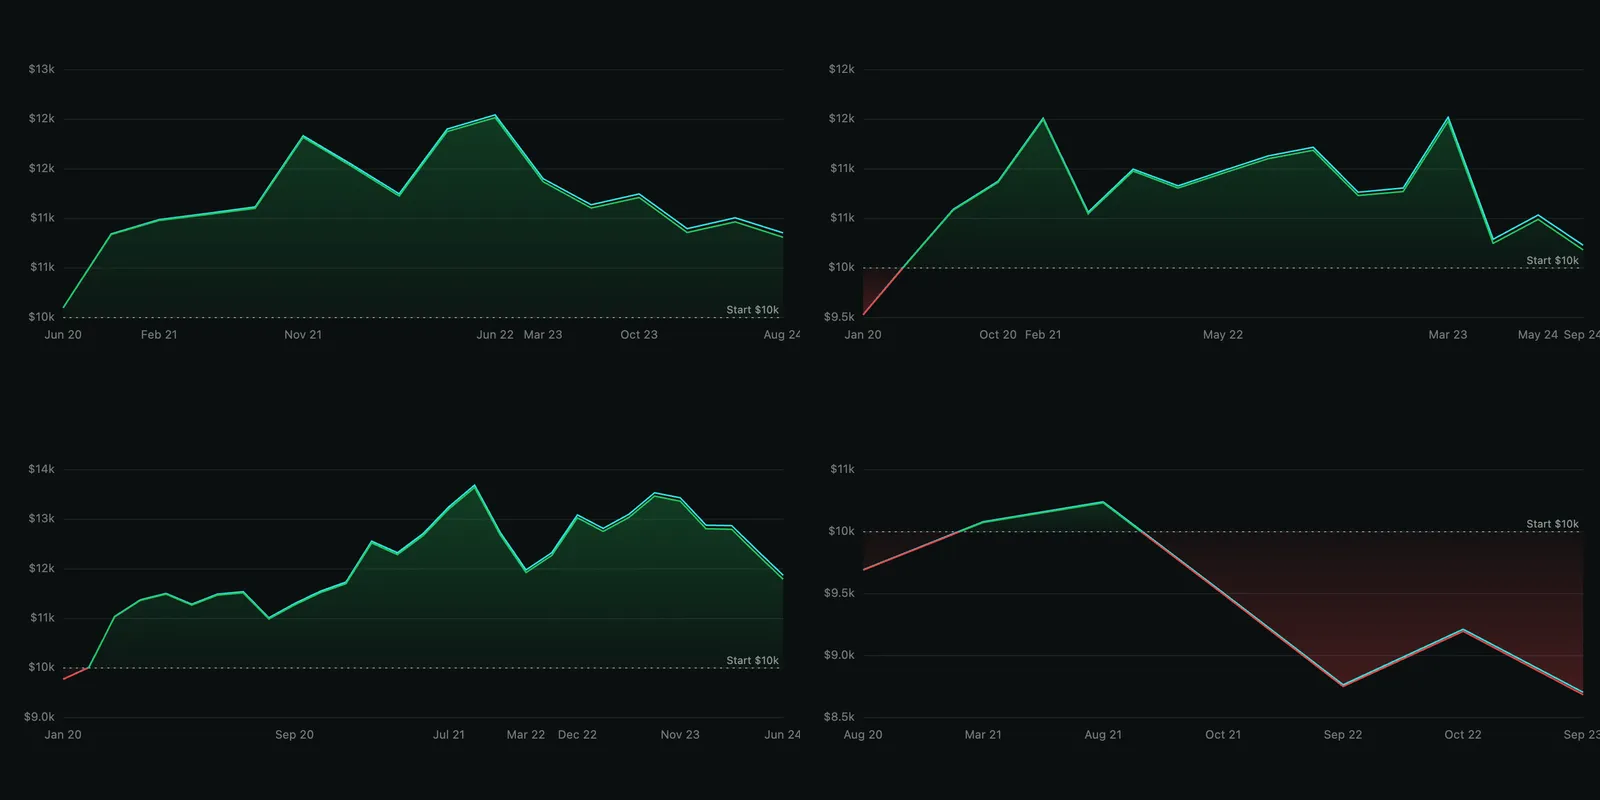
Gartley, Bat, Butterfly, Crab on ES from 2020 to 2024. One looked tradeable; the cross-instrument check killed the universal claim.
Harmonic patterns carry a mystique that few other technical setups do. The five-pivot XABCD structure, the Fibonacci ratios at B and D, the symmetry that turns up in textbooks and pattern-recognition videos: it all feels like a precise, almost mathematical reading of the market. Find the geometry, the story goes, and you find the turn.
The strength of the story is also the trap. A Fibonacci ratio is a number. A pattern that satisfies four such numbers within a small tolerance is still just a shape on a chart. The shape might mark a real exhaustion point, or it might mark a coincidence the eye is good at spotting. The only way to tell which one you are looking at is to put the pattern through a fixed rule, run it on real data, and see what the equity curve says back.
So I took the four classical harmonic patterns, Gartley, Bat, Butterfly, and Crab, and ran them through the same harness on ES from 2020 to 2024. Same instrument, same timeframe (15-minute bars, the strategy’s default), same Balanced strictness setting, same one-contract sizing, same five-year window. One section per pattern. The one that produced a real-looking edge then got a cross-instrument check on NQ and GC, because a clean equity curve on a single contract is one data point and not yet a finding.
One came out genuinely positive on its primary test. Two came out marginal. One fired so rarely on 15m that I dropped to 5m to get a usable sample, and even then it lost money. And the apparent edge collapsed once it had to generalize across instruments.
The strategy in one paragraph
The strategy detects swing pivots as they confirm and checks whether the most recent five hold the named pattern’s ratio rules within a tolerance. When a structure completes, it enters at the close of the confirming bar in the reversal direction, with a target at a 0.618 retracement of the anchor leg and a stop just beyond the completion point, both sent as a bracket. If neither side hits within a fixed window, the trade closes at the market. Every pattern in the family uses this same entry, target, and stop logic. The patterns differ only in the Fibonacci ratios that define B and D. You can see the full mechanics and parameter defaults on the Harmonic Patterns strategy page on Fractiz. The strategy ships nine patterns; this post takes the four classical ones.
Harmonic structures are rare on daily bars. A strict Gartley turns up only about once a decade on a daily chart, far too seldom to backtest. They are far more common intraday, so the strategy runs on 15-minute and 5-minute bars. 15-minute is the default, and the four sections below all run at that setting until the Crab section needs more trades.
Backtest 1: Gartley on ES 15m, 2020-2024
The classical setup. Price prints X, swings up to A, retraces 0.618 of XA to B, bounces back to C, then completes at D, 0.786 of XA back below A. The strategy enters at the close of the bar that confirms D, with a target at 0.618 of the XA anchor leg and a stop just beyond D.
The backtest returned $810.50 on $10k of starting capital, a profit factor of 1.40, Sharpe 0.23, Sortino 0.40, and a 10.04% max drawdown that was still not recovered by the end of the test. 16 trades across five years (10 wins, 6 losses, 62.5% win rate).
Profit factor 1.40 on a 16-trade sample is the kind of number that looks good on a card and is hard to bank on. Sixteen trades is not much to draw a line through. Recovery factor 0.67 says the strategy made less profit than its worst drawdown, and the max drawdown trough sits 803 days deep into the test, which means the strategy was underwater for more than two years of the five-year window before it found new highs. The shape on the chart is “drifted up early, sat in a trough for most of the test, recovered at the end.” That is closer to noise than to an edge.
Gartley on ES 15m is not a result you trade. It is a result you keep in the column that says “if it does this on more data, it might mean something.” That column should be small.
Backtest 2: Bat on ES 15m, 2020-2024
The Bat keeps the same five-pivot shape but moves the numbers in. B sits at 0.500 of XA (shallower than Gartley) and D completes at 0.886, much deeper into the XA leg, very close to X itself. The classical pitch is the tight stop: because D is so close to X, a stop just beyond X is a small distance from the entry.
The backtest returned $182.75 net, a profit factor of 1.05, Sharpe 0.04, Sortino 0.05, and an 11.44% max drawdown. 17 trades over five years (11 wins, 6 losses, 64.7% win rate).
Profit factor 1.05 is a coin flip. With realistic slippage and live-execution drift, the live edge would almost certainly be below break-even. The win rate looks promising at 64.7%, but the average winner is $343 against an average loser of $599, a payoff ratio of 0.57. Eleven small wins do not outweigh six large losses. The expectancy is $10.75 per trade, which is essentially zero in a market where commissions are $2-3 and slippage on a single ES contract can take another few ticks.
The Bat’s classical pitch is the tight stop near X. In practice the stop fires often enough to make the small target asymmetric against you. The pattern produced trades, the trades cleared their commissions, and that was about all.
Backtest 3: Butterfly on ES 15m, 2020-2024
The Butterfly is the first extension pattern in the family. B retraces 0.786 of XA, a deep pullback, and D completes at 1.272 of XA, beyond the origin. The pattern catches exhaustion as price prints a fresh extreme: the trade is taken against the move that just broke through X.
The backtest returned $1,792.75 net, a profit factor of 1.37, Sharpe 0.31, Sortino 0.46, and a 13.57% max drawdown that took 894 days to bottom out. 29 trades across five years (17 wins, 12 losses, 58.6% win rate). Average winner $392, average loser $407, expectancy of $61.82 per trade.
This is the only result in the four that looks like a real backtest finding rather than a small-sample artifact. Twenty-nine trades is a sample you can lean on, the profit factor is above the 1.30 threshold I tend to treat as “worth investigating further” rather than “noise,” the payoff ratio is roughly 1:1, and the equity curve has the right shape: a climb that is interrupted by a real drawdown in the middle and then resumes. Recovery factor 0.97 is not flashy but it is not embarrassing either, the strategy roughly made back its worst drawdown.
The drawdown is also the part that needs naming. 13.57% on a $10k account is about $1,358 down from the peak, and the trough sits 894 days into the test, meaning the strategy was underwater for around two-and-a-half years of the five-year window before it set new highs. That is a hard psychological run. Most retail traders abandon a system long before two-and-a-half years of drawdown, even when the math eventually recovers. The shape of the curve is right; the trader sitting through it has to be the right kind of person.
This is the one I would actually want to dig into further. So before I claim it as anything more than “interesting on ES,” I have to ask the next question: does the same Butterfly work on other instruments?
Backtest 4: Crab on ES 15m, then a sweep down to 5m
The Crab is the deepest extension in the family. B is a shallow 0.382 of XA, then D completes at 1.618 of XA, far below the origin. The classical reading is the highest-conviction trade of the four: a sharp reversal from an exhaustion overshoot, with a tight stop just beyond a structure that price reached only through a strong push.
On 15m the Crab fired seven times in five years (3 wins, 4 losses, 42.9% win rate, profit factor 0.43, net -$1,315.25, expectancy -$187.89 per trade). Seven trades is not a backtest, it is an anecdote. The chart shows the strategy losing on most of them. Strict pattern definitions on intraday data often produce trade counts this thin: the geometry has to satisfy four ratio constraints within a tolerance, and across a five-year window of ES 15-minute bars, the Crab geometry only set up seven times.
The honest move is to drop the timeframe until the sample is large enough to draw a line through. 5-minute bars give the strategy more setups at the cost of more noise, the trade Fractiz makes explicit on the strategy page. So I re-ran the same Crab on the same instrument and dates at 5m.
On 5m the Crab fired 18 times (10 wins, 8 losses, 55.6% win rate, profit factor 0.74, net -$1,032, max drawdown 24.71%). More trades, marginally less bad on the loss column, but worse on every other dimension that matters. The drawdown doubled. Recovery factor fell to -0.42. The expectancy stayed negative at -$57 per trade.
This is the timeframe sweep doing exactly what it should. The 15m sample was too thin to be honest about; the 5m sample is large enough to be honest about; and the honest finding is that the Crab on ES at either timeframe is not a strategy you trade. The deepest extension in the family was supposed to be the highest-conviction setup of the four. On real data over five years it is the one that loses the most.
Cross-instrument: does the Butterfly edge generalize?
The Butterfly was the only one of the four classical patterns that produced a result on ES worth examining further. A backtest on a single instrument is one data point. The fair next question, before describing anything as tradeable, is whether the same rules on a different instrument give the same shape. Same defaults, same window, just a different contract.
On NQ the strategy finished marginally positive: net $1,775.30, profit factor 1.14, 38 trades, 60.5% win rate. On the headline numbers it looks defensible: a positive PF, the biggest sample of any single backtest in this post, a win rate above 60%. But the max drawdown is 61.43%. The strategy reached a peak of around $14k in early 2022, then bled through the rest of 2022 and most of 2023 to a $6k account before recovering. A 61% drawdown is the kind of curve that ends most accounts long before the recovery ever arrives. The PF says the rule has a small mathematical edge over the five years; the drawdown says no one could actually sit through it to collect that edge.
On GC the same setup lost $3,600 across 34 trades. The win rate is 64.7%, the highest of any backtest in this post. The profit factor is 0.64, far below break-even. The average winner is $292; the average loser is $836. The payoff ratio is 0.35. The strategy wins almost twice as often as it loses and still loses $3,600, because the few losers are nearly three times the size of the winners. That is the classic high-win-rate trap, and the Butterfly on GC at this default falls straight into it.
ES looked tradeable in isolation. NQ technically holds together on profit factor but is unsurvivable in drawdown. GC has a high win rate and loses money. The same five Fibonacci ratios produced three different curves on three different contracts. The “Butterfly edge” was not a property of the pattern; it was a property of the pattern on ES at 15m over 2020-2024. The cross-instrument check turned a tentative finding into a much narrower one.
What the four backtests showed
Gartley, ES 15m
Thin sample- Net P&L
- +$810
- PF
- 1.40
- Trades
- 16
- Max DD
- 10.0%
Bat, ES 15m
Coin flip- Net P&L
- +$183
- PF
- 1.05
- Trades
- 17
- Max DD
- 11.4%
Butterfly, ES 15m
ES-only- Net P&L
- +$1,793
- PF
- 1.37
- Trades
- 29
- Max DD
- 13.6%
Crab, ES 15m → 5m
Avoid- Net P&L
- -$1,032
- PF
- 0.74
- Trades
- 18
- Max DD
- 24.7%
Four patterns, same family, same machinery, same instrument, same window. Four very different results.
The textbook narrative around the four classical patterns puts the Crab at the top: the deepest extension, the sharpest reversal, the highest-conviction trade. On real ES data over five years the Crab was the worst, both at the default 15m and at 5m. The Butterfly, which the textbook treats as the “extension pattern” rather than the marquee setup, was the only one that produced a positive result with a defensible sample size. And even that result, when held up against NQ and GC at the same defaults, turned into a much narrower claim. The pattern is not the strategy. The pattern on a specific instrument at a specific timeframe over a specific window is the strategy. Change any of those three and you are not testing the same thing.
This is the second post in a row where the punchline is the same. The candlestick-pattern backtests arrived at exactly this reframe through a different family of setups: out of six classical patterns, two produced apparent edges on NQ that did not survive a cross-instrument check on ES and GC, and the same vocabulary of “looks tradeable in isolation, fails to generalize” applied. The principle generalizes even if the patterns do not.
The high-win-rate trap on the Butterfly GC test is its own warning sign worth sitting with. A 64.7% win rate is the kind of number that sells trading courses. Without the payoff ratio next to it, that number is meaningless: it is exactly the case the accuracy trap warns about. Knowing how to read a backtest, what numbers to trust and what numbers to weight against, is the other half of the work; evaluating trading strategies covers how I read these reports before any of them turn into a real allocation.