I backtested six classical candlestick patterns. One held up.
May 29, 2026 • 14 min read
Six candlestick patterns tested on NQ from 2020 to 2024. One held up. Two failed cleanly. One fired too rarely. Two were NQ-only artifacts.
Most traders learn candlestick patterns the same way: as stories. The Hammer means buyers rejected the lows. The Engulfing candle means one side took over. The Harami means momentum is stalling. The stories are vivid and easy to remember, which is why they survive.
The problem is not that the stories are wrong. The problem is that a candle does not know whether the broader market is in a tight range, a slow grind, or a volatility shock. A pattern can be visually striking and statistically empty at the same time, and the only way to find out which one you are looking at is to define the pattern precisely, run the test, and see what the data says back.
So I ran six candlestick patterns through the same backtest harness on NQ from 2020 to 2024: Bullish Harami, Bullish Engulfing, Piercing Line, Hammer, Bearish Harami, and Inverted Hammer. Same instrument, same dates, same capital, same hold rule. Four ran on daily bars. The two that fired so rarely on daily that the test could not even start (Hammer and Inverted Hammer) were swept progressively down to 1H, 30m, 15m, and 5m to find a timeframe that produced enough trades to evaluate, and then verified against ES and GC at the timeframe where they appeared to work.
One held up cleanly across instruments. Two failed outright. One fired too rarely to evaluate. Two produced apparent edges on NQ that did not survive cross-instrument verification.
The strategy in one paragraph
The setup is deliberately blunt. Detect a named candlestick pattern on a given bar close, enter in the pattern’s classical direction at that close (long for bullish, short for bearish), hold for five bars, exit at the close of the fifth bar. No stops (see note below), no profit targets, no trend filter, no scaling. The pattern is the whole signal. You can see the full mechanics and parameter defaults on the Candlestick Patterns strategy page on Fractiz.
⚠️Warning
This is a signal-isolation test. A five-bar fixed-hold with no stop is bad risk management on a live account: five bars is plenty of time for a single bad trade to lose a serious chunk of capital. In any real deployment a hard stop is mandatory, never “no-stops.” The natural place for one is the prior swing low (for longs), the signal candle’s low, or a strong support level at a minimum. Or, if you want to experiment with the rule as it stands, keep position size small enough that a worst-case adverse move stays inside your per-trade risk budget.
The reason the test strips it back this far is that a stop is itself a rule, and its effect mixes with the pattern’s in the result. If you want to ask “does this pattern carry information,” you have to ask it without the stop’s contribution in the way. The point is one question per pattern: under a defined rule, on a defined market, over a defined window, does the pattern produce anything?
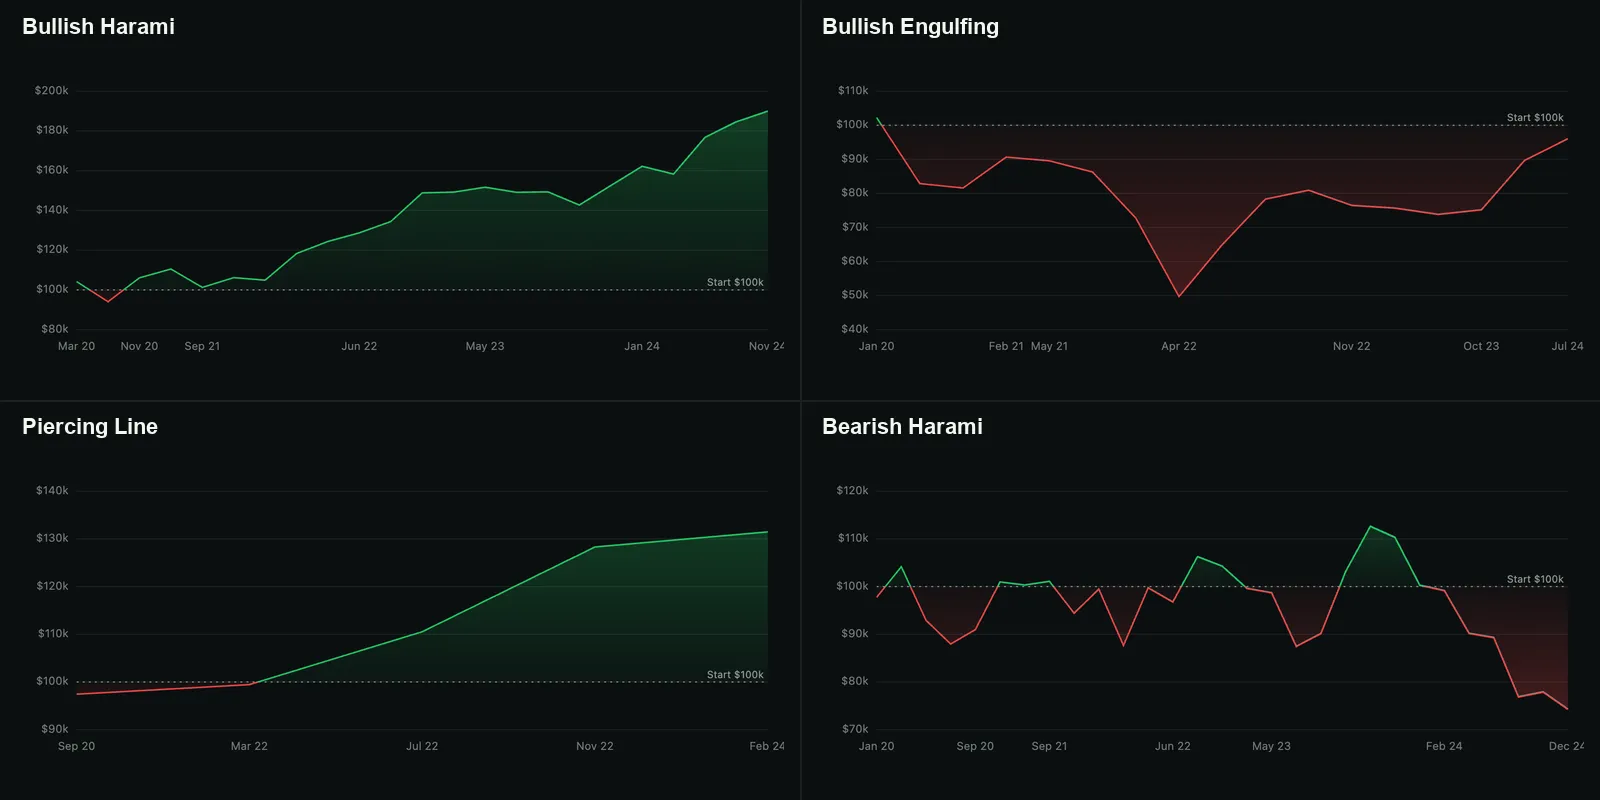
Backtest 1: Bullish Harami on NQ daily, 2020-2024
Five-year backtest on NQ daily bars. $100k starting capital, one contract per trade, five-bar hold. The pattern fires when a small up-bar’s body sits fully inside the prior down-bar’s body. The classical reading is not that buyers have taken control, but that the sellers have run out of room.
The backtest returned $89,902 on $100k of starting capital, a profit factor of 3.67, Sharpe 1.01, Sortino 2.49, and a 9.71% max drawdown that recovered in 225 days. 23 trades across five years (17 wins, 6 losses).
The story holds together. Profit factor 3.67 is unusually clean for a single-signal strategy with nothing else gating it. The drawdown is real but contained: $10,117 on a $100k account, recovered in roughly seven months. The 74% win rate is unusually high for a PF this strong (high PF usually rides on a low win rate with large outliers, not on consistent winners). Here both numbers lined up in the same direction.
The next question, every time, is whether the same defaults work on a different instrument. Same pattern, same dates, same hold rule, just a different contract.
On ES the same setup returned $27,731 on $100k, profit factor 2.84, win rate 75% across 16 trades. The shape is the same as NQ at a smaller scale: brief early dip, then a long climb that flattens in the middle of the window and accelerates near the end. Drawdown was 7.64%, manageable. Two instruments now, same direction, same broad pattern of behavior. The Harami is holding so far.
GC tells a different story. Net -$3,819, profit factor 0.82, 13 trades. The strategy climbed to about $110k by mid-2021 before fading through 2022, dropped below $100k, and ended around $94k. Same pattern, same window, same hold rule, opposite outcome on a different contract. Gold is not an equity index, and a pattern whose “sellers ran out of room” reading carries a real tendency on the index futures does not transfer cleanly to a metals contract.
So the pattern is not universally tradeable, but on NQ and ES daily over this window it carries a real tendency, and that makes it the only one of the six worth studying further as a starting point. The GC result is the reminder that “a pattern works” is too coarse a claim. The right question is always pattern plus instrument plus timeframe plus window.
A baseline test should not declare a pattern “true.” This one says the Bullish Harami deserves more research. That is what a good baseline does.
Backtest 2: Bullish Engulfing on NQ daily, 2020-2024
The next pattern is the one most traders learn first. A large up-bar fully wraps the prior down-bar’s body. The story sounds stronger than the Harami’s: buyers overwhelmed sellers in a single session, not just hesitation. Same defaults, same instrument, same window.
The backtest returned -$3,982, a profit factor of 0.94, Sharpe -0.04, Sortino -0.05, and a 51.40% max drawdown whose 816-day trough never recovered inside the test window. 17 trades (8 wins, 9 losses), expectancy -$234 per trade.
That is the second story of the post. The pattern with the better classical narrative produced the worse backtest. The account dropped to $50k by April 2022, ground its way back over two and a half years, and ended just below starting capital. Live-trading this would have been five years of stress for nothing.
On ES the same pattern lost more (-$19,490 at PF 0.65). On GC it was the only one of the three that worked (+$19,248 at PF 1.65), which is a useful flag rather than a tradeable result: a pattern that fails on two instruments and works on a third across a single five-year window is more likely to be a sample-window artifact than a real GC tendency. It would need more years and more market cycles before I would trust it.
The honest lesson here: a stronger story is not a stronger backtest. The Harami’s quiet “momentum stalling” reading produced better numbers on this instrument over this window than the Engulfing’s louder “buyers took control” reading.
Backtest 3: Piercing Line on NQ daily, 2020-2024
Piercing Line is a two-bar bullish reversal. The first is a strong down-bar. The second opens below the prior low and closes back above the prior bar’s midpoint, a partial engulfment that reclaims half the prior loss in a single session.
The headline numbers look spectacular. Net $31,456, profit factor 13.30, Sortino 5.43, a 2.56% max drawdown that recovered in 660 days. Five trades.
Five trades in five years.
There is no statistical conclusion you can draw from five trades. The curve is steep and pretty because four of the five winners landed in months that happened to favor a five-bar long hold. Whether the pattern carries a real edge or these were five lucky occurrences is a question this backtest cannot answer.
On ES the same defaults produced another five-trade sample at PF 26.28. On GC it produced one trade. Across three instruments, fifteen years of data and eleven total trades. That is a rare pattern under a strict definition, which is itself informative.
The Hammer family will show later that a strict daily definition can hide trades that fire on faster timeframes. So I ran the same Piercing Line sweep on NQ at 1H, 30m, 15m, and 5m, same dates and rules, to see if the daily sample was just hiding intraday setups. On NQ 1H it fired four times. On 30m, four. On 15m, four. On 5m, seven.
Five timeframes from daily to 5-minute and the largest sample is seven. The Piercing Line under strict rules is genuinely rare, not just rare on daily. Whatever the books say about how often this pattern shows up, the exact definition does not produce a usable sample at any timeframe on NQ in this window. The seven 5m trades that did fire produced PF 0.51 and a small net loss, so even a hint that the trades themselves carry an edge does not survive that sample.
This is what separates a rare pattern from a daily-only pattern. The Hammer sweep coming up later goes from one trade on daily to 509 on 5m, the timeframe drop unlocks the data. The Piercing Line sweep does not unlock anything. Two different shapes of “the strict daily test produced too few trades,” and only one of them has a way out.
The right move with a result like this is not to dismiss it and not to trust it. It is to file it, expand the test (more years, looser variant definitions of the pattern), and revisit. A backtest that looks too good on too small a sample is a research lead, not a strategy.
Backtest 4: Hammer on NQ daily and 1H, 2020-2024
The Hammer is the most famous candlestick pattern in the catalog. It appears in every introductory text. A small body near the high with a long lower wick after a down move, classical reading: buyers rejected the lows. I ran it on the same NQ daily setup as the others.
The backtest fired once.
A single Hammer in five years of NQ daily bars under the strict definition. The trade was a winner: $7,837 net on a long entry in April 2023. Past that, there is nothing to analyze. One trade is not a sample, it is an occurrence.
So I dropped the timeframe. Same instrument, same dates, same capital, same five-bar hold, but on hourly bars instead of daily. On 1H the pattern fires often enough to actually test:
29 trades across five years on 1H. The backtest returns -$12,025, a profit factor of 0.50, Sharpe -0.56, Sortino -0.62, and a 14.65% max drawdown whose 673-day trough never recovered inside the window. Win rate is 48.28% (14 wins, 15 losses), but the average winner ($853) is roughly half the average loser ($1,597), so the coin-flip win rate is not enough to keep the account whole.
Profit factor 0.50 means the strategy is making fifty cents back for every dollar it loses. That is not a thin edge, that is the wrong side of the trade. The most famous candlestick pattern in the catalog fires once on daily, fires twenty-nine times on hourly, and the hourly sample is large enough to show that it loses money under a straight long-and-hold rule.
On ES at the same 1H setup the pattern returned -$4,959 across 26 trades (PF 0.56). On GC, -$4,609 across 53 trades (PF 0.73). Three contracts, three losses, three different trade counts. The Hammer fails the same way on every liquid future I tested it on at 1H.
Going further down on NQ: 30m gave PF 0.77 across 81 trades, 15m gave PF 0.86 across 173 trades, and 5m crossed into barely-positive at PF 1.10 across 509 trades (+$5,750). The pattern improves monotonically as the timeframe drops, which is interesting but does not mean it works. Profit factor 1.10 is razor-thin; on 509 trades the per-trade commission and slippage drag of a live deployment would almost certainly erase it. And it does not survive the next question: on ES the same 5m setup returned -$937 across 509 trades (PF 0.97), on GC -$4,229 across 509 trades (PF 0.90). Both barely below break-even, both losing. The marginal NQ 5m positive does not replicate. Whatever produced the slight NQ 5m edge is NQ-specific and not strong enough to call a real pattern.
The looser the Hammer definition you accept, or the faster the timeframe you read, the more often the pattern fires. Speeding up the timeframe surfaced the trades hiding behind the strict daily rule, and it also surfaced what those trades actually do. Both are useful and almost never named in the books that teach the pattern.
Backtest 5: Bearish Harami on NQ daily, 2020-2024
The bearish mirror of the Bullish Harami: a small down-bar sits fully inside the prior up-bar’s body. If markets were symmetric, this should behave like the bullish version flipped upside down. Same defaults, same instrument, same window, but short instead of long.
The backtest returned -$25,750, profit factor 0.74, Sharpe -0.29, Sortino -0.39, and a 34.06% max drawdown whose 420-day trough never recovered inside the window. 29 trades (11 wins, 18 losses), expectancy -$888 per trade.
That is the other story of this post. Same pattern, mirrored direction, opposite outcome. Equity-index futures are not symmetric. NQ over this window had stronger and longer up-legs than down-legs (a property of the index itself, not of the pattern), so a “bearish momentum stalling” signal in an environment where bearish momentum repeatedly failed to develop is set up to lose money.
The takeaway is not that the Bearish Harami is broken. It is that you cannot assume a bullish pattern and its bearish mirror deserve the same treatment. They live in different market regimes and need to be tested separately, every time.
Backtest 6: Inverted Hammer on NQ 15m, 2020-2024
The Inverted Hammer is the Hammer’s lesser-known sibling: a small body near the low with a long upper wick after a down move. The classical reading is that buyers tested higher during the session before sellers faded them, with an up-day after the pattern treated as confirmation. Same defaults as everything else, same one-trade-on-daily problem as the Hammer, so I started the same way: drop the timeframe and see what happens.
Unlike the Hammer, the Inverted Hammer does not improve monotonically as the timeframe drops. On NQ 1H it fired six times (PF 0.43, -$1,382). On 30m it fired 19 times and turned positive (PF 1.54, +$1,648). On 15m it fired 46 times and looked like a real edge.
That is what the 15m NQ backtest looks like: 46 trades, profit factor 2.17, 61% win rate, max drawdown of 1.76%, the kind of clean upward curve that traders want to build a system around. Then 5m: 299 trades, PF 0.83, -$7,542. So the pattern is non-monotonic across timeframes, peaks at 15m on NQ, breaks down again at 5m.
The 15m NQ result was strong enough that I ran the same defaults on ES and GC to see whether the edge generalized. On ES: 108 trades, profit factor 0.87, -$1,772. On GC: 124 trades, profit factor 0.86, -$1,815. Both with more than 2x the NQ sample, both losing money clearly.
That is the cautionary tale of the post. A 46-trade window on NQ at 15m producing PF 2.17 with a clean climbing curve looks tradeable in isolation. The same setup on two other liquid futures with 2-3x as many trades fails decisively.
This is why every backtest in this post is checked across instruments wherever a sample exists. When a single combination looks too good, the next thing to ask is whether it survives the next combination. The Inverted Hammer’s NQ 15m number does not.
📌Note
A caveat on the cross-instrument check. This post validates across instruments. A more complete validation would also test across multiple timeframes (a daily pattern can fail intraday, and the reverse) and across multiple market regimes (a 2020-2024 result is one period of market structure; 2008, 2015, or 2030 may behave nothing like it). A pattern that works on one instrument does not automatically transfer to another, and even on the same instrument the same setup can behave differently as the underlying market structure changes. Each new axis (instrument, timeframe, regime) is its own test.
What the six backtests showed
Lining them up, same window, same defaults, dropping the Hammer family to 1H so they would fire at all:
Bullish Harami
Held up- Net P&L
- $89,902
- Profit Factor
- 3.67
- Win Rate
- 73.91%
- Max Drawdown
- 9.71%
- Trades
- 23
Bullish Engulfing
Avoid- Net P&L
- -$3,982
- Profit Factor
- 0.94
- Win Rate
- 47.06%
- Max Drawdown
- 51.40%
- Trades
- 17
Piercing Line
Too few- Net P&L
- $31,456
- Profit Factor
- 13.30
- Win Rate
- 80.00%
- Max Drawdown
- 2.56%
- Trades
- 5
Hammer · 1H
Avoid- Net P&L
- -$12,025
- Profit Factor
- 0.50
- Win Rate
- 48.28%
- Max Drawdown
- 14.65%
- Trades
- 29
Bearish Harami
Avoid- Net P&L
- -$25,750
- Profit Factor
- 0.74
- Win Rate
- 37.93%
- Max Drawdown
- 34.06%
- Trades
- 29
Inverted Hammer · 15m
NQ-only- Net P&L
- $7,759
- Profit Factor
- 2.17
- Win Rate
- 60.87%
- Max Drawdown
- 1.76%
- Trades
- 46
One of the six held up. Two failed outright. One fires too rarely to evaluate. The remaining two, the Hammer family, produce apparent edges on NQ at specific timeframes that do not survive when checked against ES or GC. That is roughly the distribution I expected, but the names attached to each bucket were not the ones I would have guessed before running the test. The Engulfing’s reputation is bigger than its backtest. The Harami’s reputation is smaller than its backtest. And the two patterns most introductory traders have memorized turn into something more subtle than “they fail”: they produce backtests that look fine on the most popular index future and quietly evaporate on the next instrument.
The cleanest reading: candlestick patterns are not strategies. They are triggers. A pattern, under a precise definition, on a defined market, over a defined window, sometimes carries a tendency and sometimes does not. The strategy lives in the combination, not in the pattern itself. The Bullish Harami on NQ daily 2020-2024 is a different strategy from the same pattern on GC daily, or on NQ five-minute, or on NQ daily over a different five-year window. Treat them as different objects and you avoid the most common mistake the pattern catalogs encourage.
For the broader argument about why thin profit factors mislead and why high win rates can be empty, see The Accuracy Trap . For how I read backtest results before deciding whether a pattern is worth building around, Why Your Trading Strategy Fails You covers what I look for. And for adjacent backtest write-ups using the same harness, Backtesting Pattern Rotation strategy and Backtesting Breakout Continuation strategy sit in the same family.