Backtesting Breakout Continuation strategy across NQ, Gold, and a Daily timeframe
April 30, 2026 • 7 min read
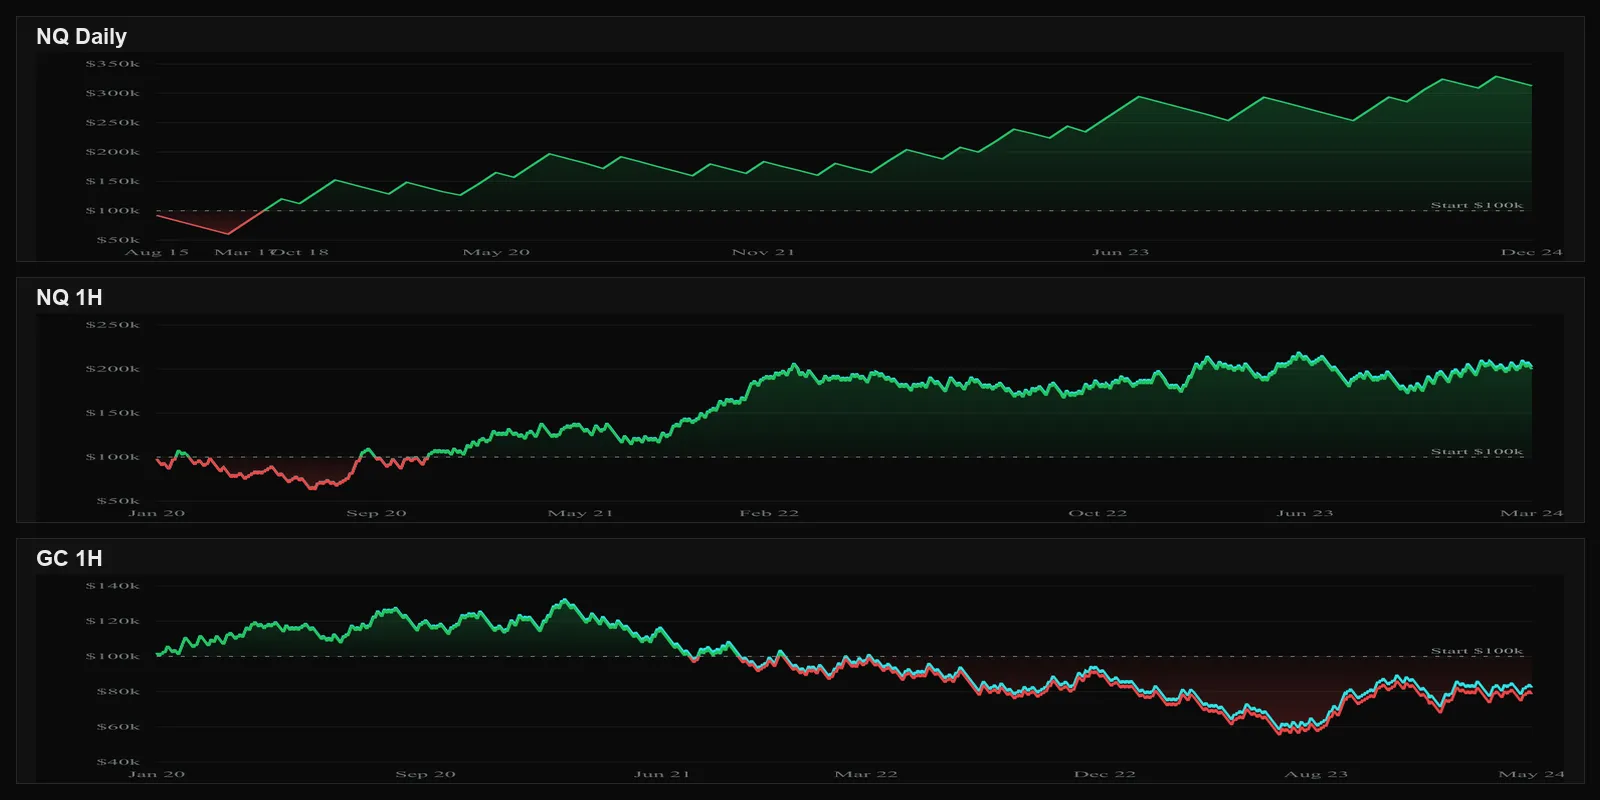
I ran a plain Donchian-channel breakout on NQ 1H, NQ Daily, and Gold 1H. One worked, one was lukewarm, one lost money.
Before you put a filter on a breakout system, you need to know what the unfiltered version actually looks like. Otherwise you cannot tell whether the filter is helping or hurting. You are just stacking rules on top of an unknown.
So before getting clever, I ran a plain Donchian-channel breakout on three different setups and looked at what each backtest produced. No volatility filter, no time-of-day windows, no higher-timeframe overlay. Just: a break above the prior N-bar high goes long, a break below the prior N-bar low goes short, fixed-points bracket exit, one position at a time.
What I found was less consistent than I expected, and more interesting because of it.
The strategy in one paragraph
On each bar close, compute the highest high and lowest low of the prior N bars. If price closes above the upper band, go long at market; if it closes below the lower band, go short. Each entry takes a fixed-points take-profit and stop-loss bracket; the bracket fully manages the trade. One position at a time. An optional cooldown skips entries for M bars after a fill so you do not stack on the same expansion candle. You can see the full mechanics on the Breakout Continuation strategy page.
In picture form, the long side. Bars range inside the channel, one bar closes above resistance, then continuation up:
The short side mirrors it. A bar closes below support, then continuation down:
That is the entire pattern the strategy is looking for, in either direction. The rest is bracket-exit mechanics. What I care about now is what those rules produce on three real instruments.
Backtest 1: NQ on 1H, 2020-2024
Five-year backtest on Nasdaq 100 futures, 1-hour bars, $100k starting capital, 200-point take-profit, 100-point stop-loss, 20-bar Donchian period.
The backtest returned $99,720, a profit factor of 1.08, Sharpe 0.50, Sortino 0.81, and a 42.10% max drawdown. The strategy made $99k over five years and asked you to sit through a 42% drawdown to collect it.
The first year is brutal. The account drops from $100k to roughly $60k by late 2020 before the 2021 trend rescues it. That is the sort of opening drawdown most traders abandon a system over, even if it eventually recovers. And looking at the detail, the maximum dollar drawdown was never recovered within the test window: the equity peak set later in the run was higher, but the deepest dollar pit was still showing as “Not yet recovered” at the end of 2024.
A profit factor of 1.08 is barely positive. The strategy makes $1.08 for every dollar risked. With realistic slippage and live-execution drift, the live edge would likely be smaller. The Sortino of 0.81 says the upside dominates the downside, but not by much.
Verdict: technically positive, but the drawdown profile is something most retail traders would not survive. This is the sort of result that motivates adding a filter.
Backtest 2: NQ on Daily, 2015-2024
Ten-year backtest on the same Nasdaq 100 contract, daily bars, $100k starting capital, 1000-point take-profit, 400-point stop-loss, 20-bar Donchian.
The bracket sizes are larger because daily bars on NQ move much more per bar than 1-hour bars do. A 200-point stop on daily would get hit on noise; a 400-point stop is a closer match to actual daily range.
The backtest returned $212,795, a profit factor of 1.56, Sharpe 0.55, Sortino 1.20, and a 39.94% max drawdown that recovered cleanly. Recovery factor was 5.18, across 78 trades over ten years.
The headline numbers are mixed. A profit factor of 1.56 is real - meaningfully better than the 1.08 on 1H. The expectancy per trade is $2,728, because daily breakouts are rare (78 trades over a decade) and the ones that fire tend to ride large multi-day moves. Recovery factor of 5.18 is genuinely strong.
The Sharpe of 0.55, on the other hand, is only marginally better than the 0.50 on 1H. Volatility-adjusted return is similar across the two. What is better here is the quality of the average trade, not the volatility profile. The strategy still asks you to sit through a 40% drawdown - just with far fewer trades along the way.
The other catch is trade frequency. Eight trades a year. You would spend most of the year sitting on your hands waiting for a daily breakout to fire. That is its own kind of psychological challenge: you commit capital, then nothing happens for months, then one trade either makes the year or hands back a chunk of it. Anyone who needs the dopamine of frequent activity would abandon this strategy by month three.
On its own terms - long-horizon, low-frequency, higher-payoff-per-trade - the curve points up. But it is not a low-volatility result. The same logic that produced a marginal outcome on 1-hour produced a stronger per-trade economy on daily, with comparable volatility per dollar of return.
Backtest 3: GC on 1H, 2020-2024
Five-year backtest on Gold futures, 1-hour bars, $100k starting capital. Same 20-bar Donchian. Bracket sizes scaled to GC’s smaller dollar moves: 20-point take-profit, 10-point stop-loss.
The backtest returned -$21,453, a profit factor of 0.97, Sharpe -0.21, Sortino -0.34, and a 58.11% max drawdown. Expectancy per trade was -$21.
The strategy did not just underperform on Gold. It lost money. Net negative, negative Sharpe, negative expectancy - none of the headline metrics suggest “needs more tuning.” They suggest “this market does not reward the structure these rules are trading.”
The first year on GC is misleading because Gold rallied through 2020 and the breakout system caught some of it. The peak of $130k in early 2021 was the high-water mark. Everything after that is a slow bleed. The account drops from $130k to $55k over roughly two years, with no clean recovery. The maximum dollar drawdown was still showing as “Not yet recovered” at the end of the test.
There is a tempting interpretation: maybe Gold just had a bad five years, maybe the strategy needs different parameters on GC, maybe the bracket sizes are wrong. All three could be partially true. But the more honest read is simpler: a profit factor of 0.97 with a 58% drawdown across more than a thousand trades is not a parameter-tuning problem. It is a structural mismatch. Whatever generates returns for breakout-continuation logic on equity indices does not exist on Gold at the 1-hour timeframe in this period.
What the three backtests showed
Three configurations of the same rules. Three very different curves.
NQ Daily, 2015-2024
Works, mostly- Net P&L
- $212,795
- Profit Factor
- 1.56
- Sharpe
- 0.55
- Sortino
- 1.20
- Max Drawdown
- 39.94%
NQ 1H, 2020-2024
Marginal- Net P&L
- $99,720
- Profit Factor
- 1.08
- Sharpe
- 0.50
- Sortino
- 0.81
- Max Drawdown
- 42.10%
GC 1H, 2020-2024
Loses money- Net P&L
- -$21,453
- Profit Factor
- 0.97
- Sharpe
- -0.21
- Sortino
- -0.34
- Max Drawdown
- 58.11%
Two things stand out.
First, the strategy works best where you might not expect it to look first. Most traders attracted to breakout systems are drawn to intraday markets - more bars, more signals, faster feedback. But on this rules set, the daily timeframe produced a meaningfully better profit factor and per-trade expectancy than the 1-hour did. The volatility-adjusted return (Sharpe) was barely different - the gain shows up in trade quality, not in volatility. The lower frequency was the cost; the higher-quality average trade was the benefit.
Second, a 0.97 profit factor on more than a thousand trades is not noise, it is information. GC 1H is not a “needs tuning” result. It is a structural mismatch between this rules set and that market at that timeframe. No amount of parameter optimization will turn a 0.97 PF with a -0.34 Sortino into something investable - not without overfitting to the test window.
The plain breakout, in other words, is honest about itself. Where it works, it works. Where it does not, it tells you so loudly. The drawdowns are the price of admission, and they are real.
What next
This is the baseline. The natural next question is whether adding a volatility-regime filter changes any of these results - whether the chop that hurts plain breakouts can be reliably skipped. I tested that on a regime-filtered version of the same Donchian logic across four configurations: Backtesting Pattern Rotation strategy with a breakout filter across four setups . Short version: the filter helped a little on NQ 1H, dragged on NQ Daily, and could not save GC 1H. The filter is not a universal upgrade.
For more on how I read backtest results before committing capital - beyond the headline numbers - see Why Your Trading Strategy Fails You . And for why a thin profit factor like 1.08 should not be confused with a real edge, The Accuracy Trap covers the trap of over-weighting headline numbers.