Backtesting Moving Average Crossover across four setups
May 26, 2026 • 8 min read
I tested moving-average crossover on NQ 1H, ES 1H, GC 1H, and the daily 50/200 golden cross. Three of four told a different story.
Moving average crossover is probably the most-discussed and most-disputed trend strategy in retail trading. Two lines. One signal. Everyone has heard of the “golden cross” because financial media writes about it every time it happens on the S&P 500. Everyone who has tried to trade it has a story about whipsaws.
What you rarely see is the numbers across multiple setups, run with the same rules, with the same execution model. Here is the strategy, here is what it produced on this contract at this timeframe with this parameter pair, here is what that meant for the account.
So I ran it four ways: three of the pre-baked samples on Fractiz, plus one custom long-horizon backtest on Nasdaq daily with the textbook 50/200 pair. The same logic everywhere.
The strategy in one paragraph
On each closed bar, compute two simple moving averages of price: a fast one and a slow one. If the fast SMA crosses above the slow SMA, go long; if it crosses below, flip short. Always in the market once the first cross fires. No bracket, no time-of-day filter, no volatility gate. Position is held until the next cross. You can see the full mechanics and parameter defaults on the MA Crossover strategy page.
The bullish setup. Fast MA crosses above the slow MA after a downtrend exhausts, signal goes long:
The bearish setup mirrors it. Fast crosses below slow after an uptrend exhausts, signal goes short:
That is the entire pattern. The rest is whatever the market does with the position once the cross has fired. What I care about is what those rules produced across four real backtest setups.
Backtest 1: GC on 1H, 10/30 MAs, 2024
The Gold 1H sample uses a faster MA pair (10/30) than the equity-index samples. One year of data, $100k starting capital.
On $100k of starting capital, the backtest returned $47,974, a profit factor of 1.33, Sharpe 1.48, Sortino 2.94, and a 14.68% max drawdown that recovered in 71 days. That came from 215 trades at a 37.67% win rate.
This is the configuration that actually holds up. Not because the win rate is good (it is not, 37% is a clear majority-losers profile), but because the average winner is over twice the average loser ($2,376 vs $1,078), the drawdown is relatively small, and the recovery is fast. A Sharpe of 1.48 is the kind of number that survives a closer look. Recovery factor of 2.98 means the worst hole was about a third of the net result.
Reading the monthly returns: the strategy lost in three months out of twelve, but the winning months were big enough to absorb the losers. February alone gave back $11k. The strategy then made it back across the summer and finished strong.
The other three backtests tell different stories.
Backtest 2: ES on 1H, 20/50 MAs, 2024
S&P 500 e-mini futures, default 20/50 pair, same one-year window, $100k starting.
The backtest returned $23,236 on $100k of starting capital, a profit factor of 1.20, Sharpe 0.68, Sortino 1.26, and a 17.87% max drawdown, across 128 trades at a 39.06% win rate.
The headline numbers are positive. The curve sits mostly above starting capital. There is exactly one brief excursion below the starting line, then it grinds upward.
But look at the rest. Profit factor 1.20 means you are making $1.20 for every dollar risked. With realistic slippage and live-execution drift, that thin a margin is exactly where the strategy starts breaking. Expectancy is $181 per trade. Max consecutive losses was nine. That is nine straight losing trades on a 39% win rate, which the math actually predicts will happen, but which most retail traders will not psychologically survive.
The strategy spent 149 days recovering from its worst drawdown. Nearly half the year. On a system that produced 23% gross return for the year, asking the trader to sit through 150 days underwater is a heavy psychological tax for a modest payoff.
This is the configuration that “works” by every technical measure and yet is not actually deployable for most people. The numbers say go, the equity curve says go, the experience of holding it says no.
Backtest 3: NQ on 1H, 20/50 MAs, 2024
Nasdaq 100 futures, same default 20/50 pair, same one-year window. This one looks like a winner at first glance and then breaks under the slightest pressure.
The backtest returned $51,948, a profit factor of 1.20, Sharpe 0.72, Sortino 1.39, and a 53.15% max drawdown, across 128 trades at a 35.94% win rate.
The 53% drawdown is not a typo. The account went from $100k to roughly $50k inside the first four months. Half the capital, gone, before the strategy did anything interesting.
Here is the metric that should stop everyone in their tracks. Max drawdown in dollars: $56,330. Net P&L for the year: $51,948. The strategy’s worst pit was larger than its final profit. The recovery factor reads 0.92, which means the drawdown ate more than the year’s total earnings. If you had been live and stopped trading at the bottom (which is what most people do), you would have lost more than the system eventually made.
It took 181 days to recover from that drawdown. Then the strategy made it back, and then some. The final number looks fine. The journey was psychologically very hard to survive for almost any retail account.
This is the trap MA crossover sets on a volatile, trending instrument with default parameters. Headline P&L positive, profit factor positive, Sharpe positive. Behavior catastrophic.
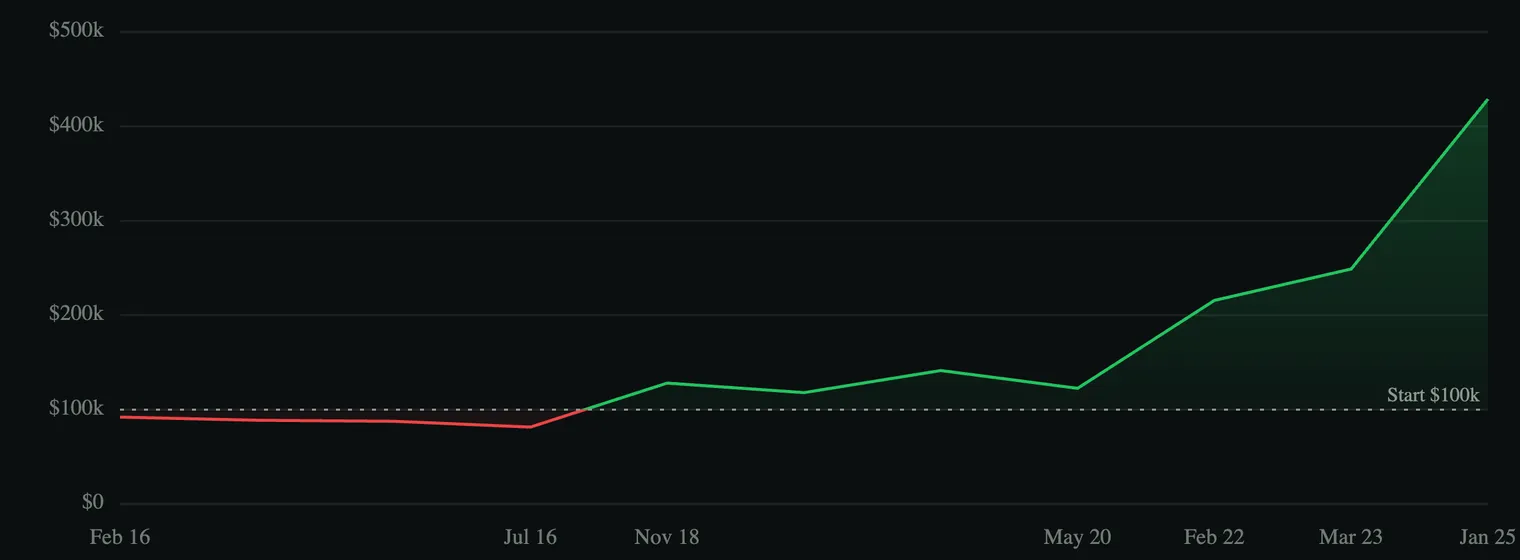
Backtest 4: NQ on Daily, 50/200 MAs, 2015-2024
Ten years on NQ daily bars with the canonical golden cross / death cross pair. The configuration every financial-media article mentions whenever the S&P prints a cross.
On $100k of starting capital, the backtest returned $328,965, a profit factor of 7.92, Sortino 4.30, and an 18.55% max drawdown, across just 11 trades.
Yes, eleven. In ten years. Average expectancy per trade was nearly $30,000.
The headline numbers are spectacular. Profit factor of 7.92 is the kind of result that gets people excited. A 329% return over ten years from a strategy you check once a quarter sounds like the dream system.
The reality is harsher in three specific ways.
Sample size. Eleven trades is not a backtest, it is an anecdote. The 7.92 profit factor is dominated by two or three enormous wins. If you remove the biggest winner (a multi-year hold during the 2020-2021 tech rally), the strategy is something much closer to “marginally positive.” There is no statistical confidence in any of the headline metrics with this many trades.
Time underwater. The worst drawdown lasted 31 days to its trough and 673 days to recover. Nearly two years sitting at the deepest pit before the strategy clawed back to a prior high. Most people abandon a system inside a year of drawdown, especially one that already only fires once a year on average.
Activity. Eleven trades in ten years means you spend 99% of your time as an investor not trading. Sit on hands. Watch the slow MA. Wait for a cross. Cross fires. Hold. Wait for the opposite cross. The dopamine-deprived version of trading. Anyone who needs to “feel productive” abandons this kind of system inside six months.
So the textbook golden cross on the textbook timeframe does produce spectacular returns over a ten-year window where equities trended hard. It also requires sample-size humility, two years of patience to survive a drawdown, and the temperament to do almost nothing for years at a stretch. Three constraints almost nobody satisfies.
What the four backtests showed
GC 1H, 10/30 MAs, 2024
Held up- Net P&L
- $47,974
- Profit Factor
- 1.33
- Sharpe
- 1.48
- Sortino
- 2.94
- Max Drawdown
- 14.68%
ES 1H, 20/50 MAs, 2024
Marginal- Net P&L
- $23,236
- Profit Factor
- 1.20
- Sharpe
- 0.68
- Sortino
- 1.26
- Max Drawdown
- 17.87%
NQ 1H, 20/50 MAs, 2024
Unsurvivable- Net P&L
- $51,948
- Profit Factor
- 1.20
- Sharpe
- 0.72
- Max Drawdown
- 53.15%
- DD > Net P&L
- Yes
NQ Daily, 50/200 MAs, 10y
Sample of 11- Net P&L
- $328,965
- Profit Factor
- 7.92
- Sharpe
- 0.48
- Max Drawdown
- 18.55%
- Total Trades
- 11
One configuration arguably held up at investable quality. One was technically positive but practically unusable. One had a survivable headline result that hid a catastrophic drawdown. And one produced spectacular ten-year numbers on a sample size too small to draw confidence from. I say arguably because different traders have different temperament and make different choices, so what is investable for one can be untradeable for another.
The same rules in every case. Two SMAs, a cross, a flip.
The lesson tracks the lesson from the Pattern Rotation backtests from a different angle. A strategy is not a thing you can move between contracts and timeframes and parameter pairs and expect the same business. MA crossover is not one strategy. It is a family of strategies that share two lines and one signal logic, and the behavior differs enough across setups that calling them all “MA crossover” hides more than it reveals.
Some of the differences are obvious in hindsight: 50/200 daily is a slow trend-rider; 10/30 hourly is a much faster instrument; 20/50 hourly on NQ is whipsaw-bait in a volatile year. Hindsight is easy. What is hard, and what the backtest set is for, is seeing those differences before you commit capital.
A profit factor of 1.20 across 128 trades and a profit factor of 7.92 across 11 trades are not the same kind of evidence. The first one is statistically real and economically thin. The second one is statistically thin and economically dramatic. Both are MA crossover, and both deserve very different treatment when deciding whether to deploy capital.
For more on why thin profit factors should not be confused with a real edge, see The Accuracy Trap . For how I read backtest results in general before committing capital, see Why Your Trading Strategy Fails You . And for the unfiltered baseline that backtests like these sit on top of, the Breakout Continuation backtest set is the closest companion piece.
The thing I keep coming back to with crossover systems: they are not the simple beginner strategy the textbooks describe. They are simple to describe. The behavior they produce is anything but simple, and the gap between description and behavior is exactly where most retail accounts get destroyed.