Backtesting Pattern Rotation strategy with a breakout filter across four setups
May 3, 2026 • 6 min read
I ran the same regime-filtered breakout on four configurations. Three broke in different ways. Here is what that taught me about strategy fit.
Every breakout system I have ever touched has the same disease: chop. Price grinds sideways, the system keeps taking small breaks, and each one fails just past the entry. You bleed out one stop at a time, and there is nothing wrong with the rules. The market just is not moving the way breakouts need it to.
The usual response to this is to add more rules. Volume confirmations. Higher-timeframe filters. Time-of-day windows. Each one trims a little off the noise and a little off the edge.
The Pattern Rotation strategy on Fractiz takes the opposite approach: it adds one filter and uses it to refuse to participate. When recent volatility is below baseline, the system stays flat. No mean-reversion fade, no defensive trade. Just nothing.
I wanted to know how well that “do nothing” actually holds up across markets. So I ran four backtests: three contracts on the same timeframe, plus one contract on a different timeframe. Same rules in every run.
The strategy in one paragraph
A standard 20-bar Donchian breakout, gated by an ATR ratio. Compare a fast 14-period ATR to a slower 50-period baseline. If the ratio is at or above 1.0, volatility is expanding and breakouts are eligible. If it is below 1.0, the system stays flat. Long on closes above the upper band, short on closes below the lower, fixed-points bracket exit. That is the whole thing. You can see the full mechanics on the strategy page.
In picture form, the long side. Bars range inside the channel, one bar closes above resistance, then continuation up:
The short side mirrors it. A bar closes below support, then continuation down:
That is the pattern the underlying breakout logic is looking for. The regime filter sits on top of it and decides when to participate. What I care about now is what those rules produce across four different backtest setups.
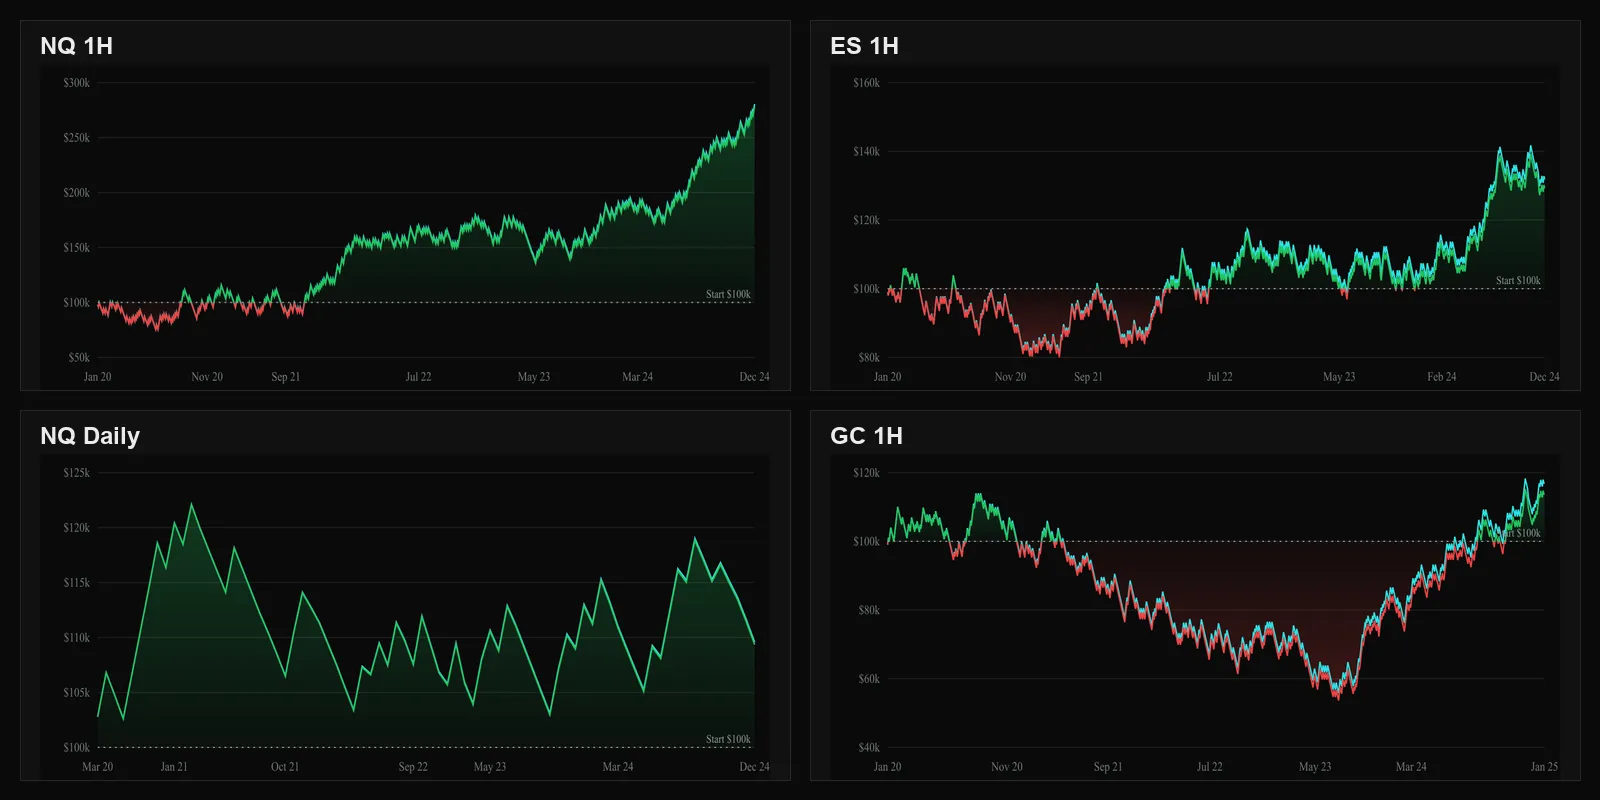
Backtest 1: NQ on 1H, 2020-2024
Five-year backtest on Nasdaq 100 futures, 1-hour bars, $100k starting capital, 200-point take-profit, 100-point stop. The default Pattern Rotation configuration.
On $100k of starting capital, the backtest returned $178,151, a profit factor of 1.16, Sharpe 0.95, Sortino 1.68, and a 24.79% max drawdown that recovered in 369 days.
This is the configuration that holds together. Not by much. A profit factor of 1.16 means you are making $1.16 for every dollar risked - positive, but slim. The drawdown is real. And the first eighteen months of the test were ugly: the strategy was underwater for most of 2020 and didn’t cleanly cross above starting capital until late 2021.
But the curve climbs. The Sortino of 1.68 says the upside dominates the downside. The 369-day recovery says the strategy claws its way out of holes in roughly a year. With small position size and patience, you could probably run this and not lose money. That alone separates it from the other three backtests.
So far, so good. The natural next backtest: does the same logic behave the same way on other contracts?
Backtest 2: GC on 1H, 2020-2024
For the second backtest, I switched the contract from NQ to Gold and kept everything else identical. Same Donchian period, same ATR windows, same threshold, same bracket. Only the exit points were rescaled to GC’s smaller dollar moves (20-point TP, 10-point SL).
Over five years, the backtest returned $13,726, a profit factor of 1.02, Sharpe 0.15, Sortino 0.24, and a 52.74% max drawdown. Time underwater was 1,555 days out of the roughly 1,826 the backtest spans, so this strategy spent 85% of the backtest in drawdown.
A profit factor of 1.02 is statistically a coin flip once you account for slippage and live-execution drift. Sharpe 0.15 means the returns barely exist relative to the volatility. Account dropped from $100k to $55k before clawing back to roughly even.
I had been operating on the assumption that the rules carried the result. They did not. Same logic, opposite outcome. The market mattered.
Backtest 3: ES on 1H, 2020-2024
The third backtest was the gut-check. ES is the S&P 500 e-mini. Same asset class as NQ, broader index, comparable institutional flow. If the strategy worked on NQ because of “equity-index futures structure,” ES should at least look similar.
The backtest returned $29,222 at a profit factor of 1.05. The curve is choppy, drifts below starting capital for over a year, and only meaningfully crosses above when it catches the rally in late 2024.
Profit factor 1.05 is barely positive. After realistic slippage and commissions over a live deployment, even that thin profit is at risk. ES sits in a different category from NQ for this strategy: not catastrophic like Gold, but not investable either.
The lesson sharpens. Whatever made the NQ 1H backtest hold together is not “equity-index futures structure.” It is specifically NQ. Whatever quality NQ’s intraday volatility regimes have - clear alternation between expansion and contraction phases on 1-hour bars - ES does not share cleanly enough for this filter to capture.
Backtest 4: NQ on Daily, 2020-2024
For the fourth backtest, I held the contract constant and changed only the timeframe. Same NQ, same 20-bar Donchian, same 14/50 ATR ratio, same 200/100 bracket. Daily bars instead of 1-hour.
The backtest returned $9,360, a profit factor of 1.10, Sharpe 0.17, across just 78 trades (versus 883 on 1H). The strategy hit its peak in early 2021 and never cleanly recovered for the remaining four years. The “max drawdown recovery” field on the backtest reads “Not yet recovered” at the end of the test window.
Sharpe 0.17 is in Gold territory. The same instrument that produced a positive curve on 1-hour now barely beats a coin flip. The reason matches a known weakness of the strategy: on daily bars, volatility regimes shift too slowly for a single-bar ATR-ratio filter to mean anything. Most days the regime classifier flips you into a position that performs no better than an unfiltered breakout would.
NQ on 1H held together. NQ on Daily did not. Same contract. Same rules.
What the four backtests showed
Lining them up:
NQ 1H, 2020-2024
Held up- Net P&L
- $178,151
- Profit Factor
- 1.16
- Sharpe
- 0.95
- Sortino
- 1.68
- Max Drawdown
- 24.79%
ES 1H, 2020-2024
Marginal- Net P&L
- $29,222
- Profit Factor
- 1.05
- Sharpe
- 0.29
- Sortino
- 0.49
- Max Drawdown
- 24.45%
NQ Daily, 2020-2024
Coin flip- Net P&L
- $9,360
- Profit Factor
- 1.10
- Sharpe
- 0.17
- Sortino
- 0.30
- Max Drawdown
- 15.66%
GC 1H, 2020-2024
Avoid- Net P&L
- $13,726
- Profit Factor
- 1.02
- Sharpe
- 0.15
- Sortino
- 0.24
- Max Drawdown
- 52.74%
One out of four configurations holds together. The other three either fail outright in the backtest or do not produce enough to deploy capital against.
The cleanest reading of this: the filter does not manufacture results. It refuses to participate when the underlying market is not offering anything. Where the market does offer a clean expansion-vs-contraction structure - NQ on 1H, apparently - the filter lets you stay in long enough to collect what is there. Where the market does not - GC on 1H, NQ on Daily, ES on 1H to a lesser extent - no filter saves you.
That is a different mental model than the one most strategy descriptions encourage. We talk about strategies as if they were portable: “the rules are the rules.” They are not. A strategy is a strategy + instrument + timeframe combination. The same rules deployed on different combinations produce different backtests.
When you see a clean backtest, the question is not “are these rules sound?” The question is “what is special about this combination that produced this curve?”
For Pattern Rotation, the answer appears to be: NQ’s 1-hour volatility happens to alternate cleanly between expansion and contraction phases that are large enough relative to the strategy’s bracket exits to matter. Change the contract, change the timeframe, and you change whether that property still exists.
The thing I keep coming back to: regime filtering does not give you an edge. It stops the market from taking yours away when it is not there to begin with. Worth backtesting. Worth understanding before you rely on it. Worth refusing to use on a market that does not give it anything to filter.
For context on what these rules do without the regime filter, see Backtesting Breakout Continuation strategy - the unfiltered baseline these rules sit on top of, tested across NQ 1H, NQ Daily, and Gold 1H.
For more on how I read backtest results before committing capital, see Why Your Trading Strategy Fails You . And for why a thin profit factor like 1.10 should not be confused with a real edge, The Accuracy Trap covers the trap of over-weighting headline numbers.