The Stock Market Looks Very Different When Measured in Gold
May 23, 2026 • 7 min read
In dollars the S&P 500 has made huge new highs since 2000. In gold, it never got back to its peak. What changes when you swap the measuring stick?
Most charts you see show stocks in dollars. The S&P 500 going from 1,500 to 6,000 is called a 4x. The Dow making a new high is called a bull market. The Nasdaq ripping is called growth coming back.
There’s one quiet assumption underneath all of that: the dollar is a fixed yardstick.
It isn’t. Fiat currencies expand. Deficits run. Central banks add liquidity. So every time an index prints a new high in dollars, there’s a fair question to ask:
Did the market actually get more valuable, or did the unit it’s measured in get smaller?
This is where gold becomes useful.
Gold is not a perfect measure of value. It doesn’t generate cash flow, doesn’t pay dividends, and its price moves with sentiment, real rates, liquidity, and fear. But it has one property the dollar doesn’t: it can’t be printed.
So instead of looking at the indexes in dollars, we can look at them in ounces:
SP:SPX / TVC:GOLD
DJ:DJI / TVC:GOLD
NASDAQ:NDX / TVC:GOLD
Each ratio answers the same simple question:
How many ounces of gold does this index buy right now?
Ratio rising means stocks are outperforming gold. Ratio falling means gold is outperforming stocks. And once you switch lenses, the post-2000 stock market starts looking very different from what the dollar charts show.
🧠Info
S&P 500 priced in gold
In dollars, the S&P 500 has gone from the 2000 dot-com peak to multiple new all-time highs. That part is real.
Now price the same period in ounces of gold.
View live: SP:SPX / TVC:GOLD on TradingView
The SPX/gold ratio hit something north of 5 ounces per S&P 500 unit around 2000. It collapsed through the dot-com bust and the 2008 financial crisis, recovered partially during the 2010s tech rally, and has yet to reclaim that 2000 high.
That’s worth sitting with:
The S&P 500 made new highs in dollars. It never made new highs in gold.
This doesn’t mean equity investors lost. It doesn’t mean stocks were a bad place to be. It doesn’t mean gold was always the better trade.
What it means is simpler:
The choice of measuring stick changes the story.
In fiat, the post-2000 chart looks like a massive secular bull market. In gold, it looks like a market that’s still digesting a 2000 valuation peak twenty-plus years later.
The denominator problem
When we say “the market is up,” we almost always mean it’s up against the dollar. But the dollar is not a constant. It loses purchasing power over time. So if dollars are the only denominator we use, we’re measuring everything against a yardstick that keeps shrinking.
S&P 500 in dollars = SPX / USD
S&P 500 in gold    = SPX / GOLD
S&P 500 in CPI     = SPX / CPI
Different denominators, different stories. Same numerator.
A stock index can rise in dollars and fall in gold. It can beat CPI and still lose to gold. It can make a new dollar high while sitting far below an old peak in any harder asset. None of those statements contradict each other. They’re just looking through different lenses.
The question worth asking isn’t “is the market going up?” but “going up against what?”
Nominal, real, and gold-adjusted are not the same
A quick distinction that gets blurred a lot:
- Nominal returns are dollar returns. Roughly what your brokerage statement shows.
- Real returns are inflation-adjusted, usually with CPI. What your purchasing power did.
- Gold-adjusted returns are returns measured in ounces. What your stocks bought in a non-printable asset.
These can disagree by a lot. The post-2000 S&P 500 is a clean example: strongly positive nominal, modestly positive real, and roughly flat-to-negative in gold across long stretches. All three are true at the same time. They just measure different things.
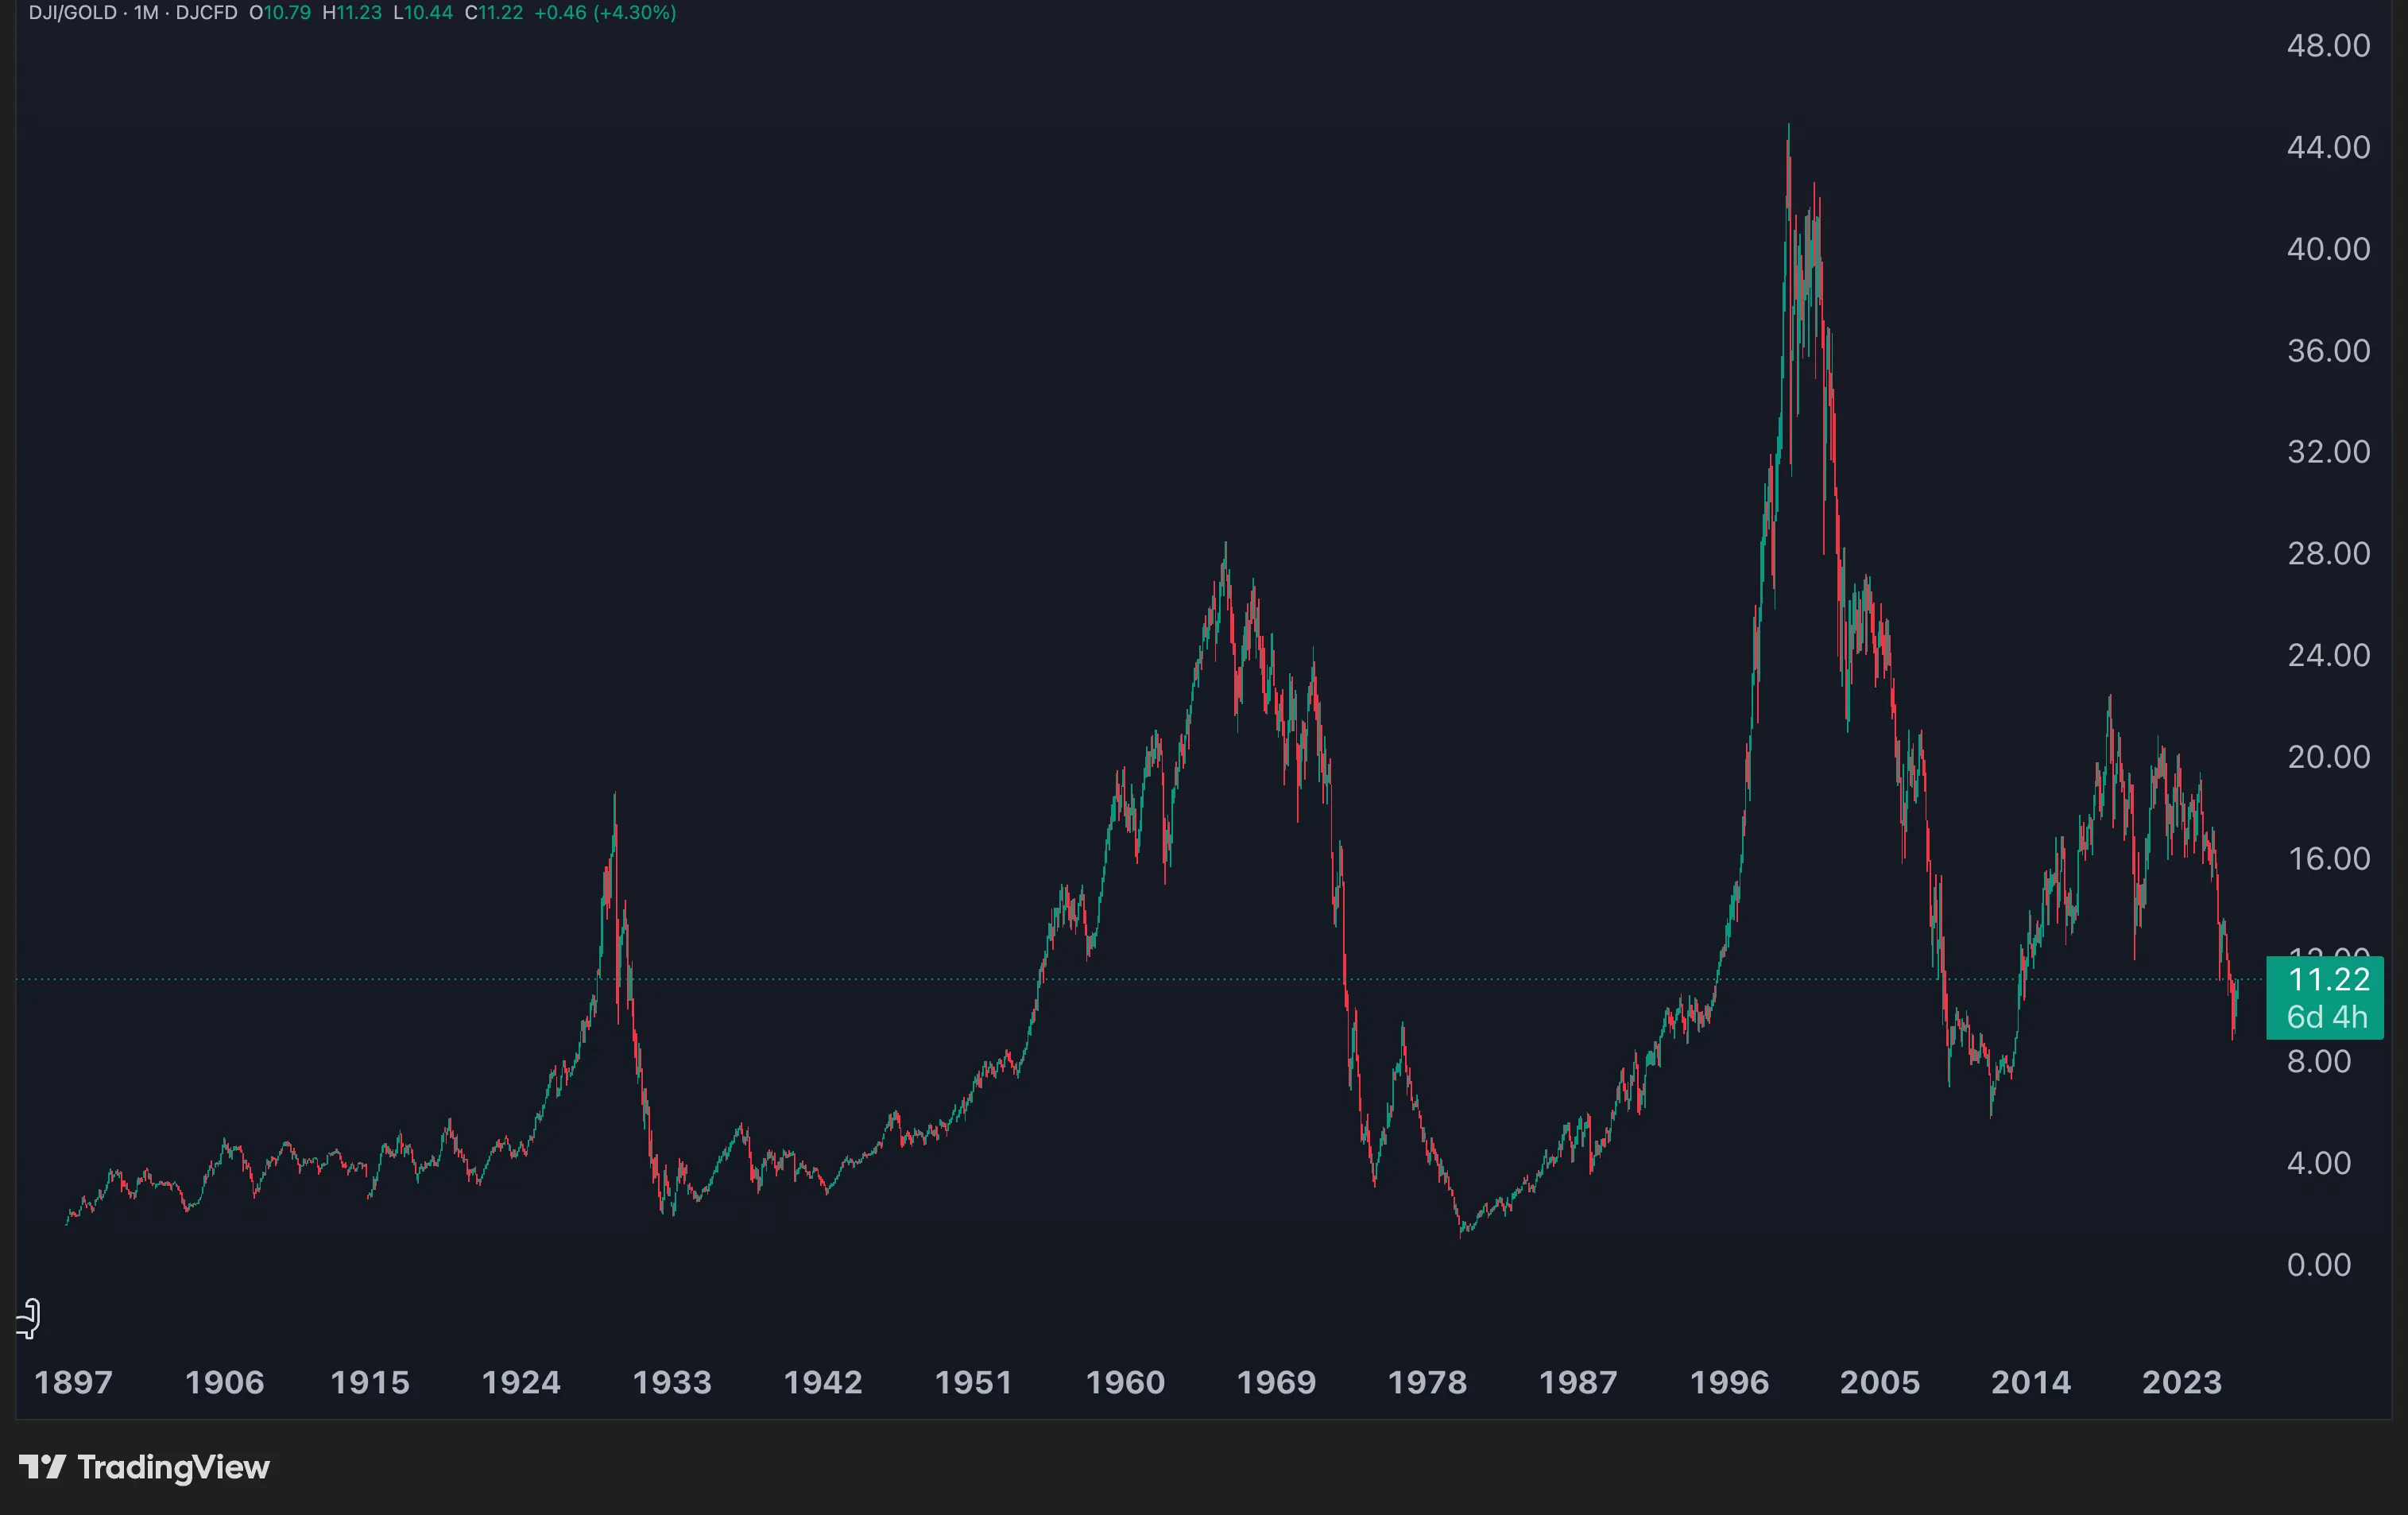
Dow / Gold: the long-cycle view
The Dow/Gold ratio is the classic version of this idea. It’s been around for decades because it captures a long-term rhythm between financial assets and hard money.
The pattern shows up across multiple cycles:
Financial-asset regime → stocks beat gold for years
Hard-money regime      → gold beats stocks for years
The big Dow/gold peaks tend to land at moments of extreme confidence in paper assets. The big lows tend to land when that confidence has been seriously damaged and capital has rotated into things you can’t print. The ratio doesn’t predict tomorrow. But it does a good job showing which regime has been winning over the cycle.
View live: DJ:DJI / TVC:GOLD on TradingView
Nasdaq / Gold: growth versus hard money
NDX/gold is the most extreme version of the comparison, because it puts two near-opposites side by side. The Nasdaq 100 is concentrated in technology and growth: long-duration cash flows, high optionality, lots of expectations baked in. Gold is the opposite end: no earnings, no growth, just a monetary asset with a fixed supply curve.
So the Nasdaq/gold ratio is really a measure of:
growth vs hard money
risk-on vs scarcity
optimism vs caution
The 2000 peak in this ratio was extraordinary. The dot-com bubble didn’t just make tech expensive. It made tech extremely expensive against the most monetary asset on the planet. The collapse that followed was equally extreme. Even the powerful 2011-2021 tech rally did not reclaim that 2000 gold-adjusted high.
That’s not a knock on tech. It’s a reminder of how stretched valuations were at that specific moment.
View live: NASDAQ:NDX / TVC:GOLD on TradingView
A few honest caveats
Three things keep this analysis from getting misread.
Starting in 2000 is not neutral. It’s the biggest equity valuation peak of the modern era. If you start any “stocks vs X” comparison from that exact moment, stocks will look weaker than if you started from 1995 or 2003. The gold lens makes the moment look extreme, which is the whole point. But you can’t separate the lens from the starting bar.
The price index is not the total return index. SPX/gold charts almost always use the price index, which leaves dividends out. Real long-term equity returns include reinvested dividends, and they compound meaningfully. A fairer “investor performance” version would be S&P 500 Total Return / Gold. That chart would look noticeably better for stocks. So the price-index/gold ratio is a regime indicator, not an investor-return chart.
Gold is not CPI. This one matters. Gold and consumer inflation are very different things. CPI tracks a basket of goods and services. Gold is a monetary asset that responds to real rates, liquidity, currency confidence, and crisis demand. It can run hard ahead of CPI for years. It can also drift below CPI for years. So treat SPX/gold as a “stocks versus hard money” chart, not a “real return” chart. They’re not the same.
How the ratio actually moves
The ratio doesn’t say anything directly about whether stocks or gold are going up in dollars. It only says which one is winning.
Stocks up, gold down         → ratio rises hard
Stocks up, gold up faster    → ratio falls
Stocks down, gold down more  → ratio rises
Stocks down, gold up         → ratio falls hard
Both fall about equally      → ratio is flat
This is the bit that trips people up. A rising SPX/gold ratio does not mean stocks are going up. It can rise in a falling-stock environment if gold is falling faster. A falling ratio does not mean stocks are crashing. It just means gold is winning the race, in either direction.
In other words:
The ratio is a relative statement, not a directional one.
That’s worth holding onto. People look at “SPX/gold is rising” and assume it means stocks. It only means stocks are beating gold, which could happen in a hundred different macro setups.
Where the ratio sits today (and why “today” matters less than you think)
Wherever SPX/gold prints on the day you’re reading this, the more useful question isn’t “is the level high or low?” It’s “which path from here would actually move it?”
There are really only four:
Stocks rise, gold falls       → very bullish for the ratio
Stocks rise faster than gold  → bullish for the ratio
Stocks fall, gold falls more  → ratio still rises
Stocks fall, gold rises       → ratio falls further
A clean “equities are back” outcome needs one of the first two. Capital has to come out of hard assets and back into financial ones. The ratio improving via the third path is technically the same number but a very different macro picture (both falling, gold falling worse). And the fourth is the regime that started after 2000 and has been reasserting itself in waves ever since.
The ratio doesn’t tell you which one is next. It tells you which one is happening right now.
Stocks have done what stocks were supposed to do since 2000, in dollars. In gold, they’ve spent twenty-plus years working through one extraordinary peak. Whether the next decade closes that gap or widens it is the open question worth holding in your head.
The dollar chart and the gold chart are both real. They’re just measuring different things.
Related: the gold-silver ratio applies a similar relative-value lens to precious metals.